Contribute Data
This site only works because people share the data they find or create. (See the background page for more info.) If you have some motor data that you don't see on this site, please submit it. To contribute data, find the motor you have data for, then click the contribute it link at the bottom of the motor page. Take a look at the list of motors that are missing data.
Please login or register to get started.
Also take a look at all the
other rocketeers
who have contributed data.
Thank you!
Making Motor Files
If you can't find data for a motor you need anywhere, you can easily make it yourself. This page describes creating data for a motor in the RASP format since that has become most common for interchange. Here are two examples: the Rocketvision F32 and the Propulsion Polymers J140. For more information, see the RASP Format page. (Sadly, both of these manufacturers no longer exist, but the examples are still good.)
This page tells you how to make RASP files by hand. There is also a tool you can use to trace the thrust curve from a graph image and produce RASP data files automatically. See the TCtracer page for more info. There's even a video to show just how easy it is to make a data file.
You can also make RockSim (RSE files) using the EngEdit program, see below.
Rocketvision F32
First of all, we look at the NAR data sheet to find out the information for the header line. We need values for at least the dimensions, total weight and propellant weight. (For details, see the RASP Format page.)
; Rocketvision F32
; from NAR data sheet updated 11/2000
; created by John Coker 5/2006
F32 24 124 5-10-15 .0377 .0695 RV
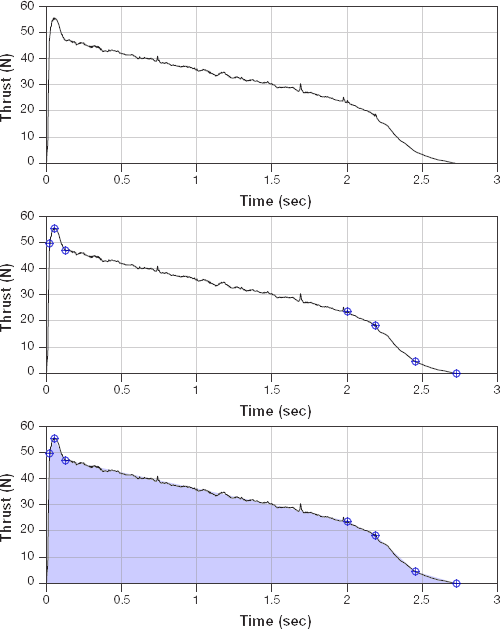
Now the more interesting part, extracting the sample data points. First all of all, we need to find a good quality graph of the thrust during the motor burn. This can be obtained from the manufacturer or from the testing organization. In this case, there are nice graphs on the NAR data sheets.
We need to pick inflection points on the graph to enter as sample data points. The key is to find points between which the curve is a relatively straight line. If the curves goes up and down above that line, it's still OK. The goal is to get a simple set of points that bounds the same area and has roughly the same shape as the graph.

Note that this thrust curve is relatively simple and we were able to capture it well with only seven data points.
Finally, we need to transcribe the data points from the graph into the file as pairs of numbers. (Note that we can use the defined burn time from the data sheet to locate the final point.) And here is the complete RASP file:
; Rocketvision F32
; from NAR data sheet updated 11/2000
; created by John Coker 5/2006
F32 24 124 5-10-15 .0377 .0695 RV
   0.01 50
   0.05 56
   0.10 48
   2.00 24
   2.20 19
   2.45  5
   2.72  0
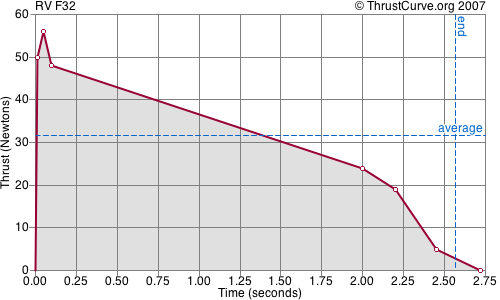
Here is the graph generated by this site when the file was contributed and we can easily verify that the data we entered is a good fit to the motor.

And there you have it! Making your own data really isn't that hard and it allows you to simulate a flight using a motor previously unavailable. Plus, if you contribute it to this site, it'll be available for others to use as well.
Propulsion Polymers J140
From the CAR data sheet we create the header. The only thing to note is that the data sheet doesn't list the propellant weight explicitly, but we can easily calculate it by subtracting the burnout weight from the total weight (Loaded Weight).
; Propulsion Polymers 664NS-J140
; from CAR data sheet
; created by John Coker 5/2006
J140 38 881 P 0.626 1.166 PP
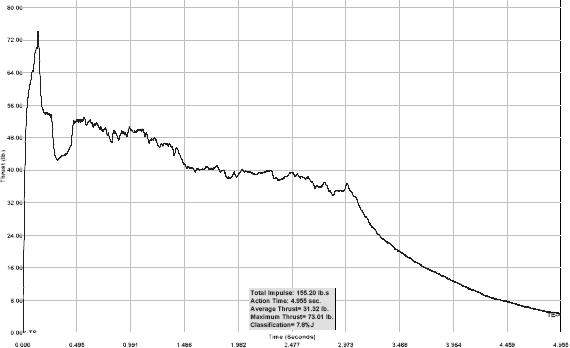
(The graph is a little hard to read on the web, but CAR provides a PDF version which can be printed for much easier reading.) Now let's take a look at the thrust curve from the CAR graph:

Right away, we can see that this is raw data from a single firing, not an averaged and smoothed "representative thrust curve." That's OK; we just have a little more work to do. First of all, we don't need to capture every peak and valley, especially since the exact shape of the curve would be different for every motor tested. That's good because 32 data points wouldn't be nearly enough to capture all the detail of this graph.
The second thing we notice is that the thrust curve is chopped off where the thrust drops below 5% of the maximum. The data sheet indicated burn time of 4.92s does not include the long tail-off of thrust that we see in the graph. So now we have to choose between trying to match the graph or the printed specs. Let's compromise and put the ending zero thrust point a tiny bit after where the graph cuts off (say at 5.0s).
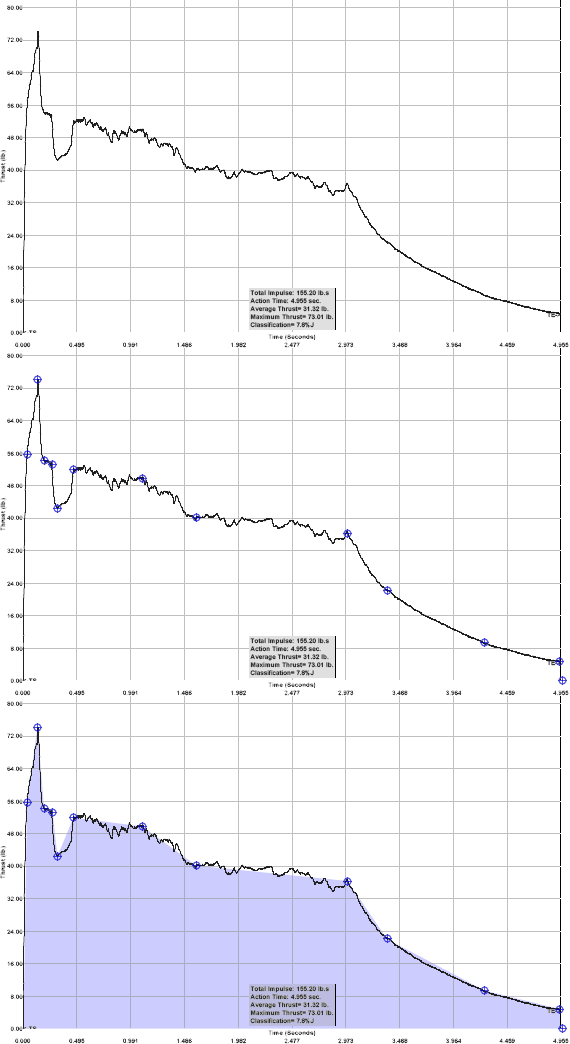
Again we pick points, this time it takes 13 samples to even get close to the printed graph:

Finally, we need to transcribe these points for the data. Watch out though; the graph shows thrust in pounds of force and we need Newtons for the data file. It's easy to convert since 1lbf = 4.45N. (Actually, it's more like 4.44822N, but that's way more precision than this process supports.)
So, we just multiply each thrust number by 4.45 when transcribing it:
| Time | Thrust Calculation | ||
|---|---|---|---|
| 0.02 | 56 | 4.45 | 249.2 |
| 0.20 | 72 | 4.45 | 320.4 |
| 0.25 | 54 | 4.45 | 240.3 |
| 0.30 | 53 | 4.45 | 235.85 |
| 0.35 | 43 | 4.45 | 191.35 |
| 0.45 | 53 | 4.45 | 235.85 |
| 1.15 | 50 | 4.45 | 222.5 |
| 1.60 | 40 | 4.45 | 178 |
| 3.05 | 37 | 4.45 | 164.65 |
| 3.40 | 23 | 4.45 | 102.35 |
| 4.25 | 10 | 4.45 | 44.50 |
| 4.95 | 5 | 4.45 | 22.25 |
Finally, we're ready to add the sample values to the RASP data file! Here they're rounded off since there's not that much precision in this process anyway.
; Propulsion Polymers 664NS-J140
; from CAR data sheet
; created by John Coker 5/2006
J140 38 881 P 0.626 1.166 PP
   0.02 249
   0.20 320
   0.25 240
   0.30 236
   0.35 191
   0.45 236
   1.15 223
   1.60 178
   3.05 165
   3.40 102
   4.25 45
   4.95 22
   5.00 0
And there you have it. This motor was a little more tricky, but by carefully picking the points, we can have confidence that it is a good representation of the burn.
File Accuracy
It's important to note that motors vary from firing to firing. The NFPA standards only require that production motors be roughly consistent. See the Certification page for more info.
A "representative thrust curve" is formed by averaging multiple firings and smoothing the curve. The advantage of doing this is that variances between motors are reduced and the curve is a better approximation of a typical motor. But in the end a representative thrust curve or data from a single firing are both fine for our purposes, especially given the inherent inaccuracy of the transcription process.
After uploading your file (or when viewing anyone else's file), you can compare its statistics to the certified values on the motor file page. At the top right is a comparison table; here is the one for the RV F32 example above (with the total impulse row highlighted):
| This File | Certified | ± | |
|---|---|---|---|
| Diameter | 24mm | 24mm | = |
| Length | 124mm | 124mm | = |
| Prop. Weight | 38g | 38g | = |
| Total Weight | 70g | 70g | = |
| Avg. Thrust | 31.7N | 29.1N | +9% |
| Max. Thrust | 56.0N | 55.6N | +1% |
| Total Impulse | 81.3Ns | 79.2Ns | +3% |
| Burn Time | 2.6s | 2.7s | −6% |
Note that none of the statistics are exactly the same, but I got within 2.7% of the total impulse which is close enough given the variation between motors.
Data Source
When you upload a motor file, you must select the "Data Source". This is an indication of where you got the data you are uploading. Please select from the following:
- Certification Org you downloaded this file from a certification organization web page.
- Manufacturer you downloaded this file from the motor manufacturer's web page.
- User-Created you created this file yourself from a printed thrust curve or other data.
Licensing
Please consider releasing data files you create into the public domain or under a free usage license. You can indicate the license under which the data is distributed when you upload it. Indicate the class of license for the data by selecting from the following:
- Public Domain least restrictive terms: anyone may do anything with the file.
- Free Usage traditional free software licenses (I.e., GPL, Creative Commons, Apache).
- Other (restricted) another, more restrictive license such as an explicit copyright.
- Unknown the data was taken from somewhere else and the license is unknown.
RockSim Engine Files
The other common format distributed on this site is the "RSE" XML format introduced by RockSim. This format is harder to create manually, but Apogee provides the EngEdit program to author these files.
For those interested in the details, Apogee has published a brief description of the file format.
